
Your candidate NPS fell from +15 to +5 this quarter, and the hiring manager wants to know what broke. Before anyone rewrites the rejection emails, run two checks. Is the drop bigger than the noise in your sample? And did the mix of candidates who answered change? This guide works through both checks with real numbers, gives benchmarks by stage, and ends with a five-step plan for a drop that turns out to be real.
What cNPS measures and how to calculate it
The candidate net promoter score (cNPS) asks one question on a 0–10 scale: "How likely are you to recommend applying to [Company] to a friend or colleague?" Following Bain's Net Promoter definition, people who answer 9–10 are promoters, 7–8 are passives, and 0–6 are detractors. The score runs from −100 to +100.
cNPS = % promoters − % detractors
Example: 120 candidates respond. 54 are promoters (45%), 30 are passives (25%) and 36 are detractors (30%). The cNPS is 45 − 30 = +15.
The formula hides two things. Passives don't appear in it, but they still count in the total. And a blended score depends heavily on which candidates answered, which is where most false alarms come from.
Two setup choices decide whether the number can be trusted later:
- Fix the wording and the moment. Ask about recommending applying, not working there, because rejected candidates never worked for you. Send the survey once, when the candidate leaves the process (hired, rejected or withdrawn), and tag each response with the last stage reached.
- Close each period on a fixed day. In Ashby's data, 94% of responses arrived within nine days. Count a response in the period its invitation was sent, and close the period 10 days after the last invitation. Otherwise, late answers move last month's score after you've reported it.
cNPS benchmarks by stage
A hired candidate and a candidate rejected after applying have very different experiences. Compare each stage with its own benchmark, and never compare your blended score with someone else's.
Starred's 2024 benchmark data splits scores by where the candidate left the process:
| Where the candidate left the process | cNPS (Starred, 2024) |
|---|---|
| Rejected after application | −14 |
| Rejected after phone screen | −12 |
| Rejected after assessment | −23 |
| Rejected after interview | +1 |
| Withdrew | +40 |
| Hired | +82 |
Ashby's candidate-survey data covers 67,400 survey requests and 11,900 responses from January 2022 to October 2023. It adds the piece most guides leave out: who actually responds.
| Furthest stage reached | cNPS (Ashby) | Response rate (Ashby) |
|---|---|---|
| Pre-onsite | 18 | 16% |
| Onsite | 28 | 21% |
| Offer | 62 | 27% |
| Hired | 85 | 43% |
Hired candidates respond at almost three times the rate of early-stage candidates, and they score highest. So a raw blended score leans toward your happiest candidates. The overall average response rate in Ashby's data was 17.8%, and the average cNPS was 37.
So what's a good candidate experience NPS? Set a target for each stage, not one company-wide figure. A practical first goal is to beat the benchmark at your largest rejected stage. For most teams that's rejected after application, where −14 is the line to beat. A rejected group that scores above zero is a strong result: more rejected candidates would recommend applying than would warn people off. For hired candidates, anything under +70 points to a problem in the offer or onboarding steps, not in screening.
Check 1: Is the change bigger than the margin of error?
An NPS has a margin of error like any survey result. Work on the −1 to +1 scale, where N is the score as a decimal and p is each group's share of responses:
Var = p(promoters) × (1 − N)² + p(passives) × (0 − N)² + p(detractors) × (−1 − N)²
Margin of error (95%) = 1.96 × √(Var ÷ n) × 100
Worked example: a 10-point drop that isn't a drop
- Q2: 120 responses (54 promoters, 30 passives, 36 detractors). cNPS +15, margin of error ±15.3 points.
- Q3: 100 responses (40 promoters, 25 passives, 35 detractors). cNPS +5, margin of error ±16.9 points.
- The change: the margin on the difference between two independent scores is 1.96 × √(7.79² + 8.65²) = ±22.8 points. The standard errors are 7.79 and 8.65 points.
A 10-point fall sits well inside ±22.8. These numbers don't show that anything changed.
To run the check in a spreadsheet, put the promoter, passive and detractor shares in cells P, A and D (as decimals), the score in N (as a decimal) and the response count in n. Then:
=1.96*SQRT((P*(1-N)^2 + A*N^2 + D*(-1-N)^2)/n)*100
How many responses you need
At a typical spread of answers (variance about 0.69):
- ±15 points needs about 118 responses per period.
- ±10 points needs about 266 responses per period. At a 17.8% response rate, that's about 1,490 survey invitations.
- 5 responses give a margin of about ±86 points, which is too wide to support any decision.
If you can't reach those volumes, report on a rolling six-month window instead of monthly. Also track the detractor share at a single stage, which moves less than the overall score.
Check 2: Did the stage mix change?
A blended cNPS is a weighted average of the stage scores, with each stage weighted by its share of responses. So it moves whenever the mix moves, even if no candidate had a worse experience.
Worked example: −13 points with no stage getting worse
This example holds Starred's stage scores constant: hired +82, rejected after interview +1, rejected after application −14.
| Q1 responses | Q2 responses | |
|---|---|---|
| Hired (+82) | 40 | 15 |
| Rejected after interview (+1) | 60 | 45 |
| Rejected after application (−14) | 100 | 140 |
| Blended cNPS | +9.7 | −3.4 |
In Q2, hiring slowed and more applicants were screened out early. The headline fell 13 points, yet every stage scored exactly the same as in Q1.
To fix the headline, report a mix-adjusted cNPS. Weight this period's stage scores by a fixed baseline mix, such as last year's share of responses by stage. In the example, Q2's mix-adjusted score is still +9.7: unchanged, which is the right answer.
When cNPS really drops: a five-step check
Use this checklist once a drop has passed both checks. The thresholds are working rules of thumb, so tune them to your volume.
- Confirm it at stage level. Treat a stage's move as real if the stage has 100 or more responses in the period and the change exceeds the margin on the difference. Also treat it as real if the score has fallen in the same direction for two periods in a row.
- Find the stage with the biggest gap. Rank stages by the change from last period, then by the gap to the stage benchmarks above. Work on one stage at a time.
- Check time in process for that stage. In Ashby's data, rejected candidates' cNPS fell from about 39 to 14 once their process ran past 60 days. If the stage's median days to decision rose, fix speed before anything else.
- Code the detractor comments. Take the latest 50 comments from 0–6 scorers at that stage. Tag each one: silence or slow updates, rejection without a reason, interviewer conduct, process length or assessment, or role mismatch. If one tag covers 30% or more, that's your fix.
- Change one thing and re-measure. Keep the question wording, timing and stage identical for one full period. If you change two things at once, you won't know which one worked.
Two habits keep the data clean. Don't reword the 0–10 question partway through a series. And don't survey only after interviews: rejected applicants are usually your largest group and your lowest score.
How to do this in Talenteria
If you run your candidate experience survey in Talenteria, you can build this setup from the standard survey tools.
Build one form per stage
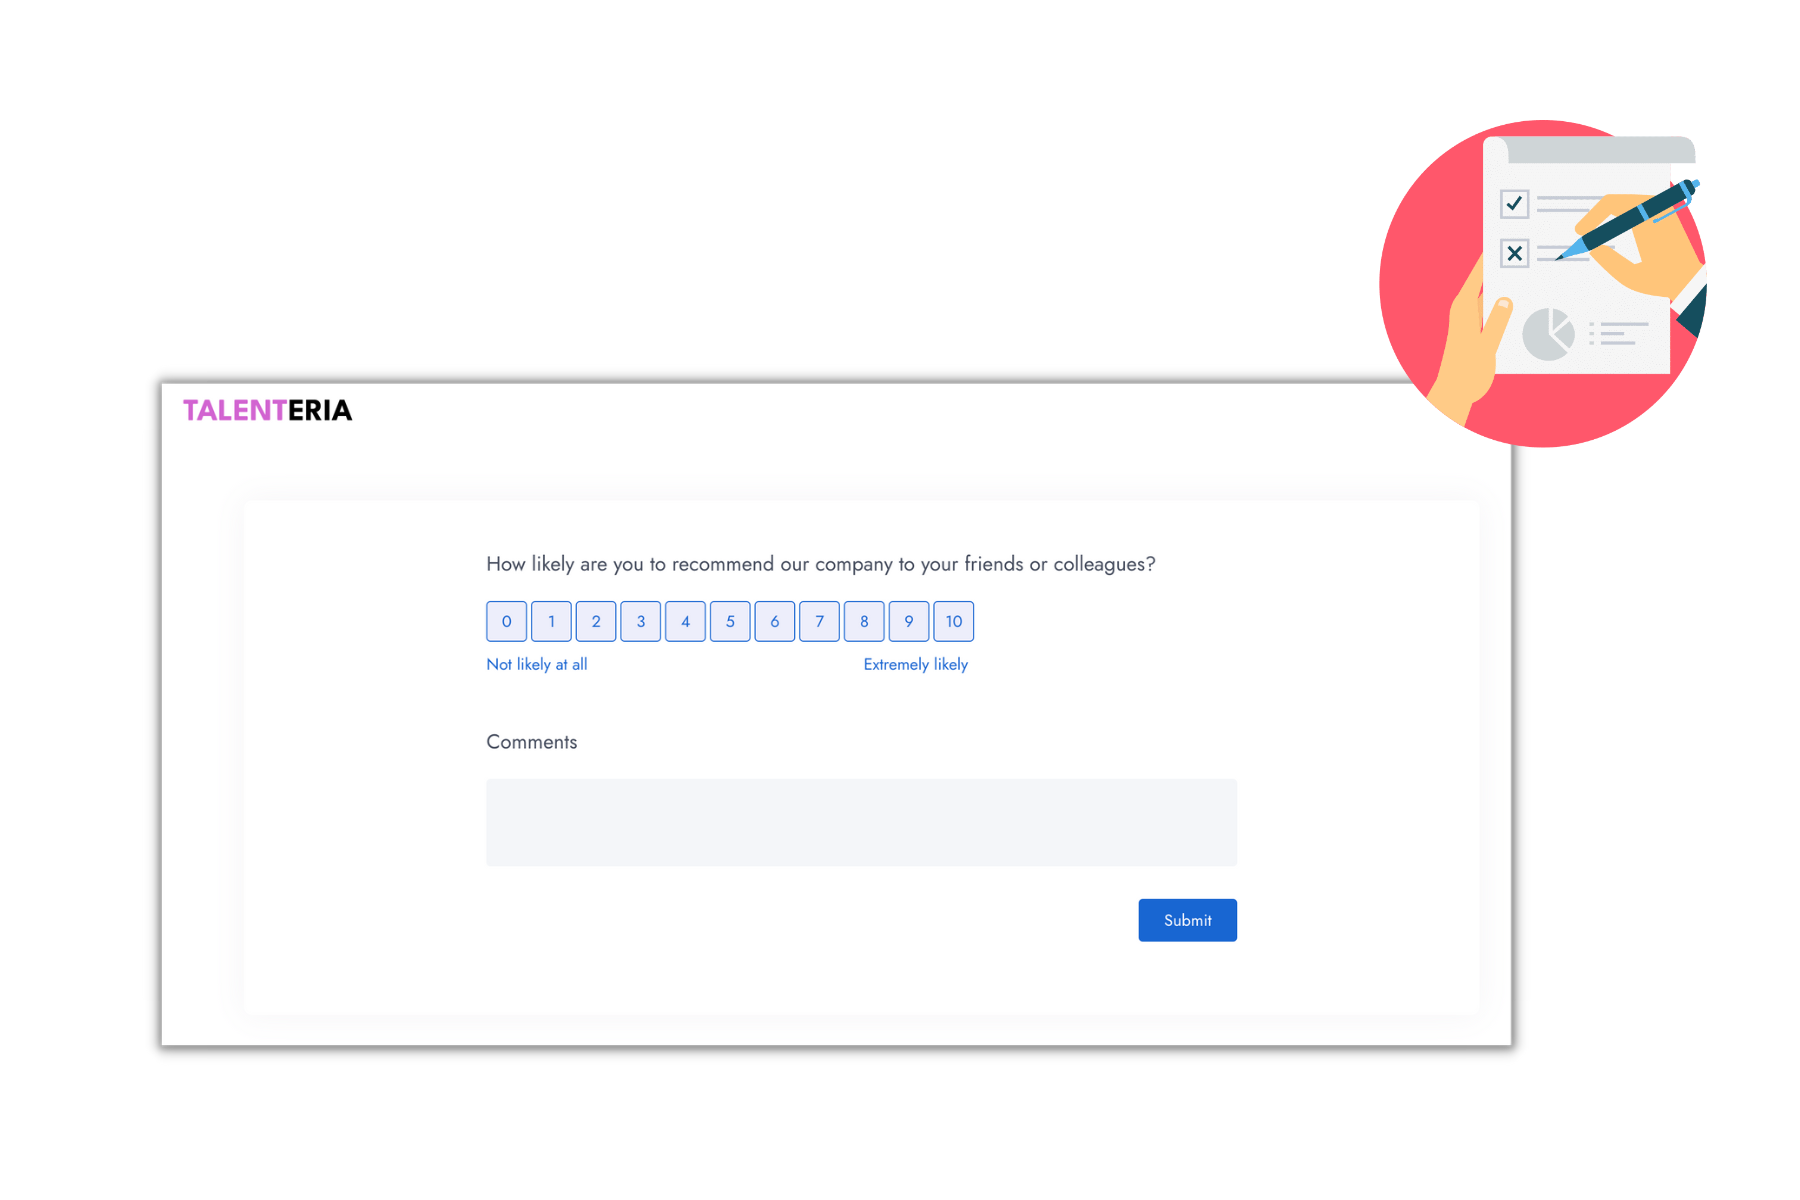
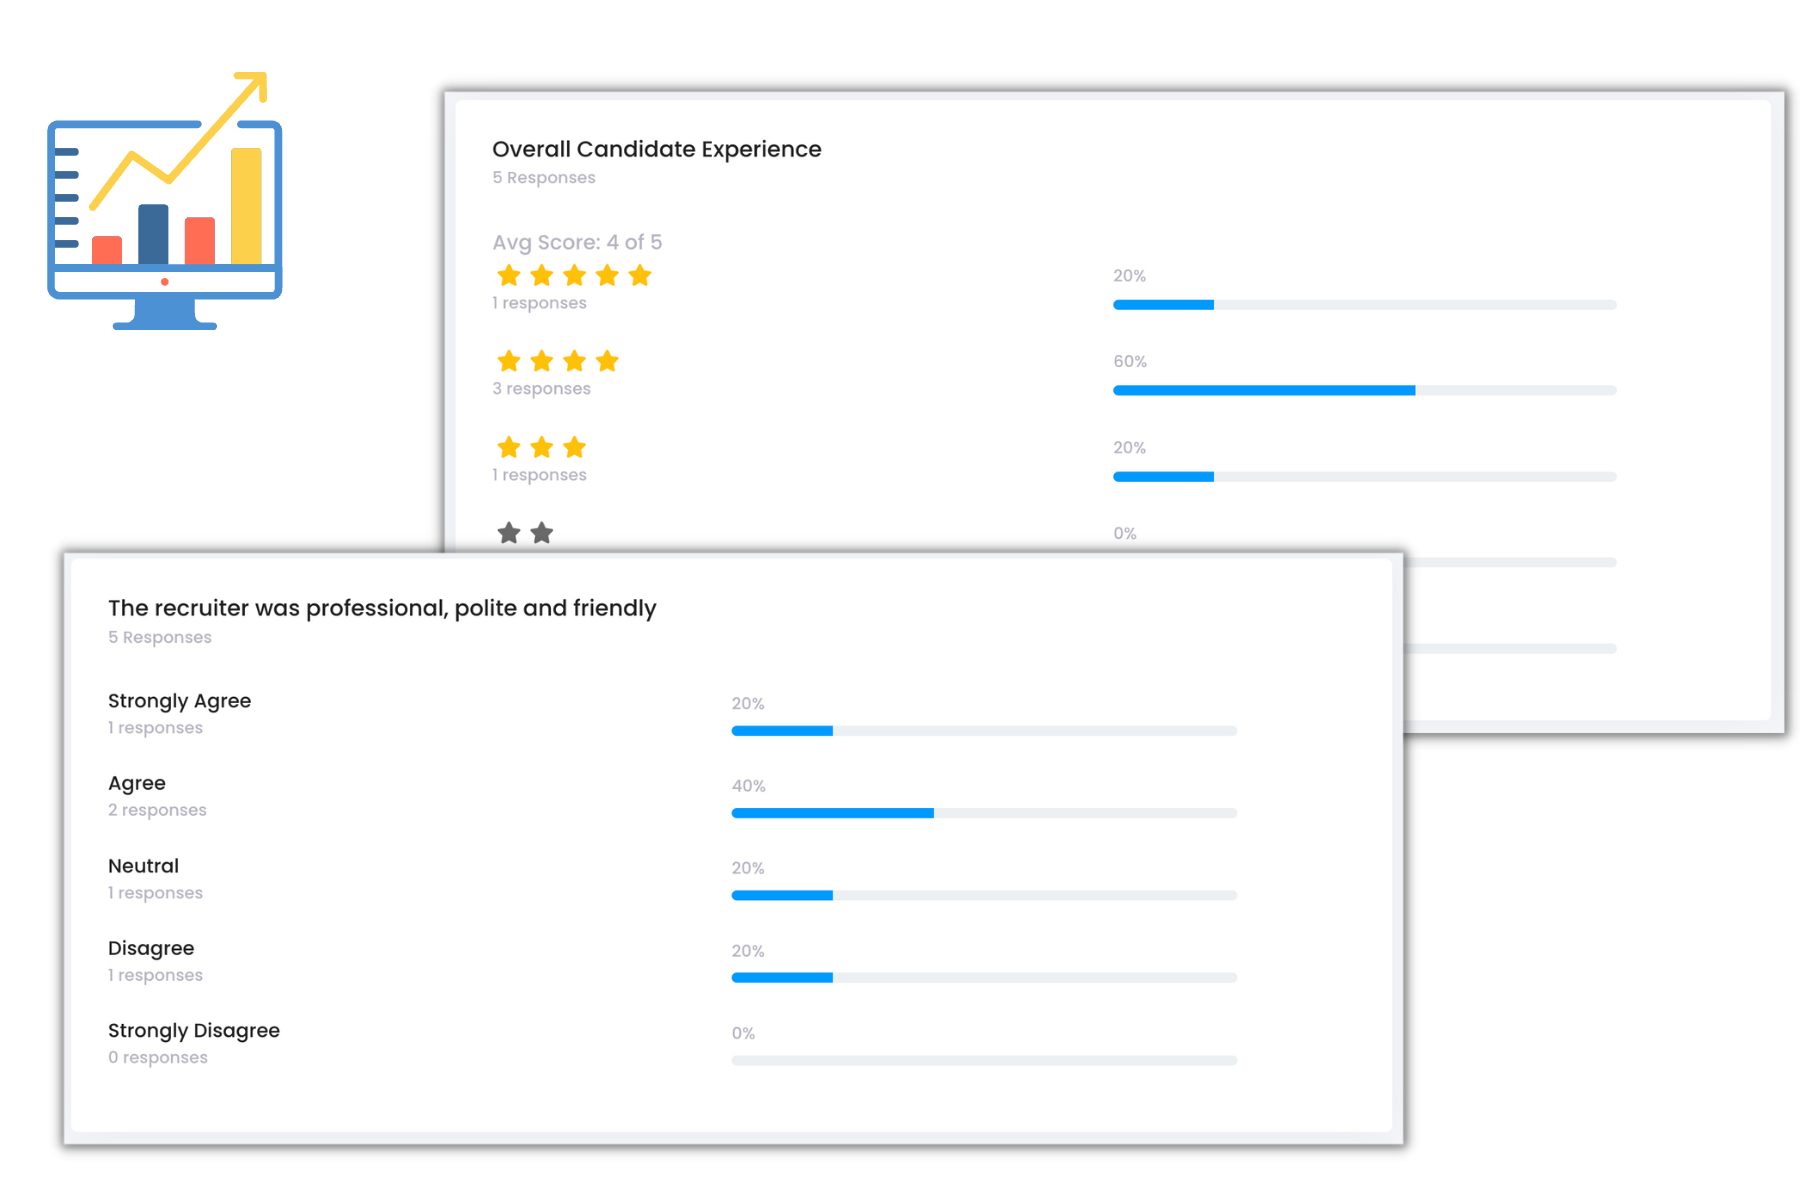
In Candidate Surveys → New Form, add an NPS question. NPS is a built-in question type, alongside rating scale, single choice, multiple choice and text. Add two or three rating-scale questions as drivers, such as "The recruiter kept me informed." Create a separate form for each stage, so each form's results give you that stage's score.
Send at the right moment
For interview-stage forms, set the form's auto action to send automatically after the interview is marked as completed. For candidates rejected before an interview, use the form's Copy Link and add it to your rejection email. Application-stage rejects then make it into your data too.
Read results with the checks above
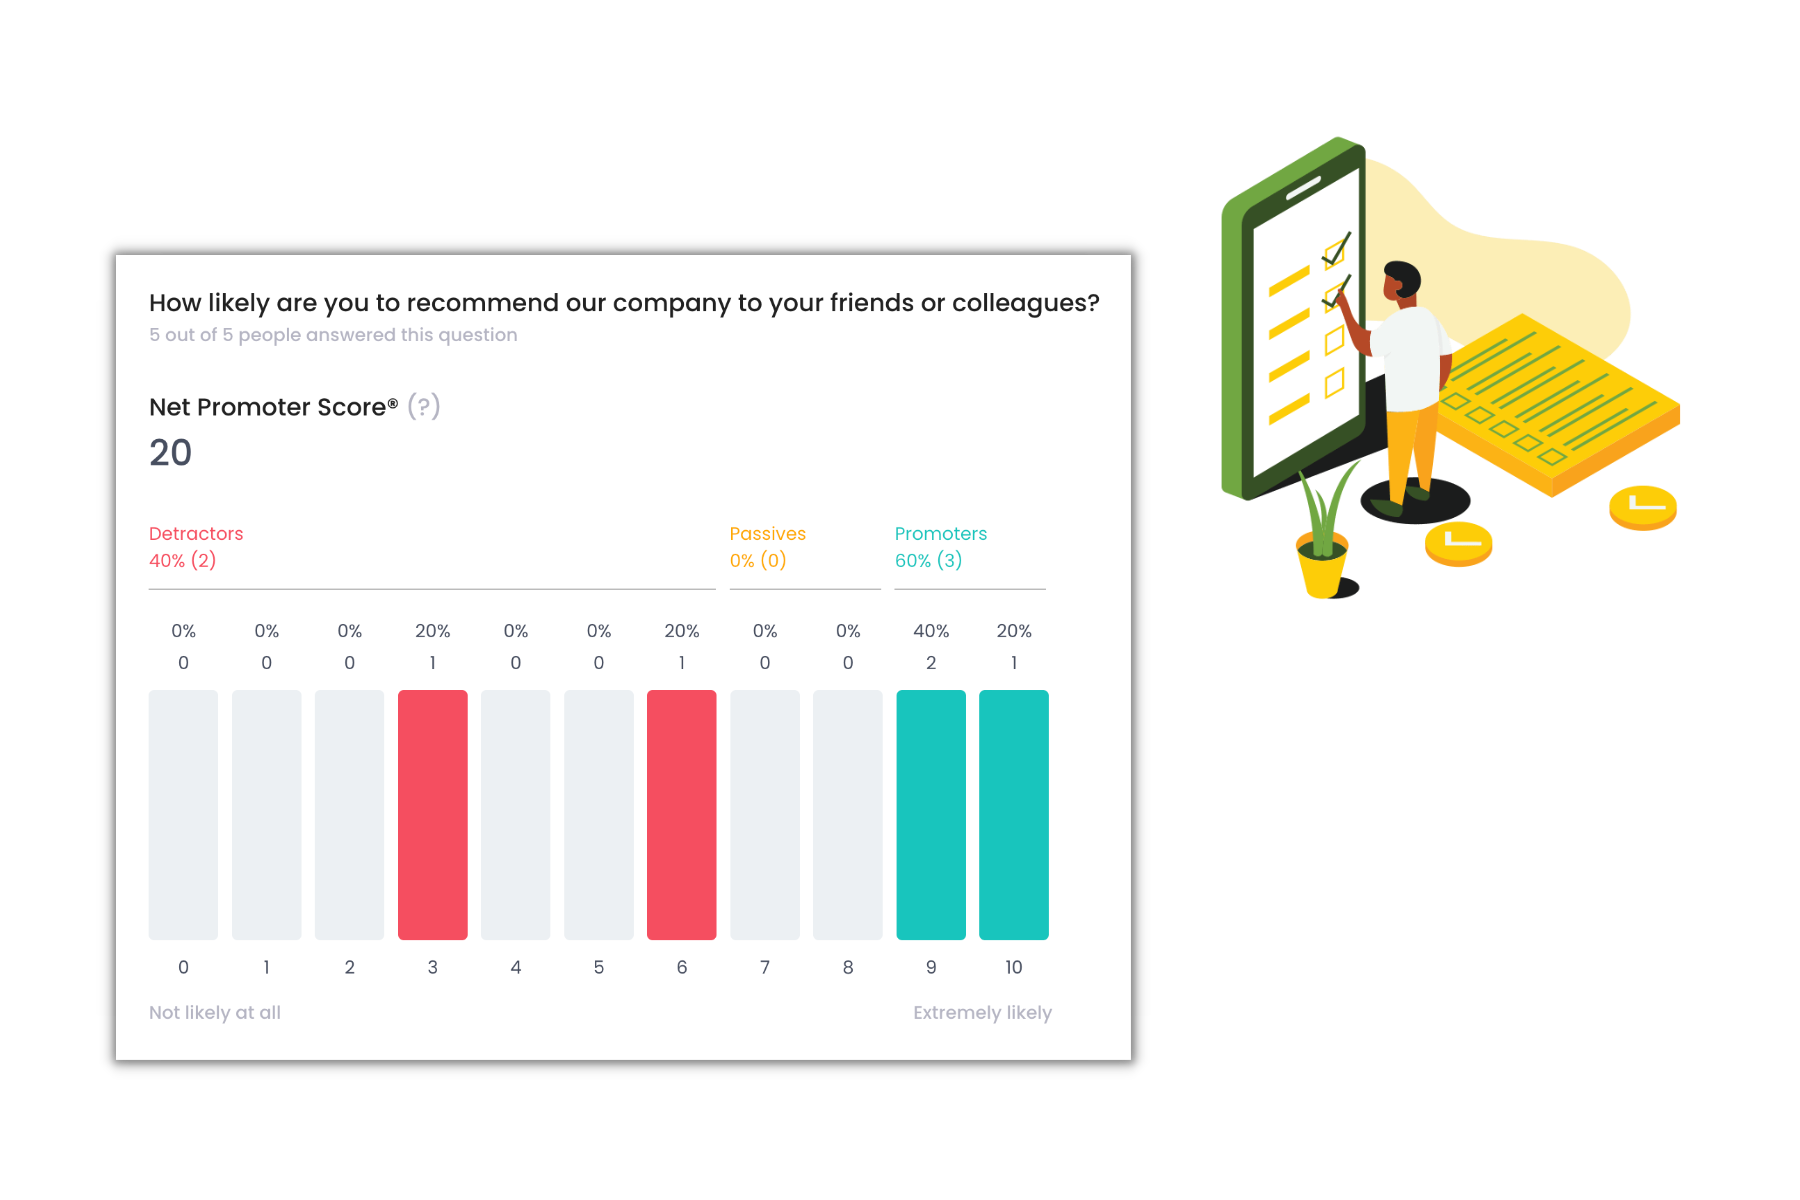
Open the form's Results to see the NPS with its promoter, passive and detractor split, the driver answers, and real-time response rates. Before you act on a score, run the margin-of-error check.
The takeaway
The score is useful once you stop reading it as a single number. Check the margin of error before you react. Report by stage, or mix-adjusted, so a hiring slowdown doesn't look like a candidate-experience failure. That's the difference between a candidate NPS that drives decisions and one that just triggers meetings. When a drop survives both checks, find the stage, check speed, code the comments and fix one thing. To set up stage-level candidate NPS surveys with automatic sending after interviews, see what Talenteria can do for your hiring team.


